This is an old revision of the document!
Table of Contents
ARM hardware debugging
| ARM devboard debugging | |
|---|---|
 |
|
| founder: | abyssal |
| depends on: | |
| interested: | - |
| software license: | - |
| hardware license: | - |
~~META: status = active &relation firstimage = :project:armpowered.png ~~
Introduction
This project was originally aimed at debugging Stellaris Launchpad board (ARM Cortex M4F), but can be applied to ARM-related and OpenOCD-supported devices as well. There is also some information on using external hardware JTAG debuggers.
Links
- Quick steps to setup Stellaris Launchpad - quick setup of StellarisWare, toolchain; should be enough to compile most basic examples
- Recommended toolchain - note: be extremely sure to “make clean all” in StellarisWare directory (including hardware library, you'll sidestep linker issues)
- HOWTO make malloc and _sbrk work with newlib - there's noone or nothing to clear .bss and initialize data sections for you
- Diagnosing Software Faults in Stellaris Microcontrollers - how to diagnose what happened when your program ends up in hard fault (e.g. precise bus error, imprecise bus error)
- Stellaris LM4F120 LaunchPad Evaluation Board - the short manual with pinout
- LM4F120H5QR datasheet - the long LM4F120H5QR manual (note: LM4F120H5QR is the same as TM4C1233H6PM)
- ARM v7 Architecture Manual - (not-so-great) instruction reference
- lm4tools - tools for flashing and manipulating Tiva/Stellaris Launchpad
- libopencm3 - library for various functions integrated on common ARM processors
- RIFF JTAG - “Big” JTAG for phone/tablet-like processors ARM7/ARM9/ARM11, Cortex A8/A9/15 - unfortunately not free software and Windows only
- Flyswatter - ARM + MIPS JTAG compatible with OpenOCD
- OpenOCD FT2232H based JTAG Adapter - DIY JTAG based on FT2232H mini module
OpenOCD debugger + Qt Creator
OpenOCD is on-chip-debugger project that allows one to debug code with a GDB-machine-interface frontend - like command-line GDB itself, Qt Creator or Eclipse.
Building
Compilation for Stellaris Launchpad, required version of openocd >= 0.7.0 (TI link for reference):
./configure --enable-maintainer-mode --enable-stlink --enable-ti-icdi
Add the usual “–prefix” before “make” and “make install”, just keep it somewhere in $PATH. You may add multiple boards with –enable-XXXX, like J-Link or Buspirate support. Starting with version 0.8.0 OpenOCD seems to enable all supported adapters by default, so there's no need to specify them.
Udev rules for debugger devices
If you haven't done so yet, create a rule file in /etc/udev/rules.d/, otherwise openocd won't work for non-root users.
Example of /etc/udev/rules.d/51-arm-development.rules, substitute your_username for the username openocd should run under:
#Stellaris/Tiva Launchpad ICDI
SUBSYSTEM=="usb", ATTR{idVendor}=="1cbe", ATTR{idProduct}=="00fd", MODE="0600", OWNER="your_username"
#ST-Link/v2
SUBSYSTEM=="usb", ATTR{idVendor}=="0483", ATTR{idProduct}=="3748", MODE="0600", OWNER="your_username"
#Segger J-Link
SUBSYSTEM=="usb", ATTR{idVendor}=="1366", ATTR{idProduct}=="0101", MODE="0600", OWNER="your_username"
Connecting OpenOCD to Qt Creator
In one terminal, connect to on-chip-debugger (modify the path for configuration file depending on where you installed OpenOCD):
openocd --file ~/sat/share/openocd/scripts/board/ek-lm4f120xl.cfg
If you're using external JTAG, you may have to specify it as interface for openocd, following example shows usage for ST-Link/v2 JTAG connected to STM32F4 microcontroller:
openocd -f interface/stlink-v2.cfg -f target/stm32f4x_stlink.cfg
Now, from running Qt Creator, select from main menu Debug-Start Debugging-Attach To Remote Debug Server. Make sure to fill out Debugger to arm-none-eabi-gdb pointing to your toolchain's GDB debugger. Local executable should point at compiled ELF executable. Host:port combo will default to localhost:3333.

Select Window-Views-Debugger Log.
Write three commads to the debugger log (this could be likely automated using the startup script option):
monitor reset halt
load
monitor reset init
The monitor reset halt will halt execution, the load command will load your ELF binary, monitor reset init will restore program to beginning. Resume execution (F5 key by default) to run the program. You can e.g. set breakpoints now or pause execution:

Qt Creator 3 requires GDB with Python scripting support
If you get error message from Qt Creator that GDB does not support Python scripting, you'll need to recompile GDB with Python support. Download GDB, configure it with:
./configure --target=arm-none-eabi --with-python
Qt Creator 3 has also a bit different dialogs, you'll need to point Qt Creator to the ARM GCC and GDB in Tools→Options→Build&Run by creating a new “kit” where you specify path to arm-none-eabi-gcc compiler and arm-none-eabi-gdb debugger.
JTAG vs SWD interface for debugging with external HW debugger
SWD (Serial Wire Debug) is a newer HW debug interface, using only 2 pins (SWDIO and SWCLK) instead of the 5-pin JTAG. SWD should be compatible with all ARM processors. The SWDIO and SWCLK pins are overlaid on the TMS and TCK pins of original JTAG header.
From OpenOCD's point of view, the physical connection doesn't matter.
Breakpoints and stepping
Breakpoints should work as usual, just don't forget “-g” flag and use no optimization “-O0” with gcc CFLAGS (last -ON flag “wins”).
Caveats - SIGTRAP, long "step over" delay
If you are getting “SIGTRAP” shown from Qt Creator, delete old breakpoints and restart the program anew - reset or physically disconnect Stellaris Launchpad.
If “step over” is taking way too long (tens of seconds or minutes), it may mean that you've tried to step over a cycle or an expanded macro. Temporary breakpoint is much faster. Nevertheless, you may watch console output of openocd to see that the program is actually running, showing the PC register and waiting the breakpoint to hit.
Hard fault interrupt encountered, possibly due to optimization (FaultISR)
This section briefly covers how to find out why your code ended in FaultISR - which is usually the default fault handler set in StellarisWare projects. Follow Diagnosing Software Faults in Stellaris Microcontrollers.
Example showing Imprecise bus fault
How to trigger an IMPRE fault (imprecise bus error) we'll show as an example. Look at blinky.c from StellarisWare, there is a “seemingly unnecessary line” with assignment to the ulLoop variable in the main() method:
//
// Enable the GPIO port that is used for the on-board LED.
//
SYSCTL_RCGC2_R = SYSCTL_RCGC2_GPIOF;

//
// Do a dummy read to insert a few cycles after enabling the peripheral.
//
ulLoop = SYSCTL_RCGC2_R; // <--- !!! if commented out, may cause imprecise bus error with gcc's -O2 optimization !!!

//
// Enable the GPIO pin for the LED (PF3).  Set the direction as output, and
// enable the GPIO pin for digital function.
//
GPIO_PORTF_DIR_R = 0x08;
GPIO_PORTF_DEN_R = 0x08;
Try commenting out the line with assignment to ulLoop, compile with -O2 -g (e.g. add CFLAGSgcc=-O2 -g) to Makefile. If you used the same toolchain (linked above as “recommended toolchain”), nothing will blink. When you attach using OpenOCD, you'll see that you've ended up in FaultISR.
Getting code completion working for StellarisWare, DriverLib, UsbLib
Easiest way is to have StellarisWare open as project. From File-New File or Project, select Import existing project, then select StellarisWare directory. In the second step where the dialog asks you to check subdirectories to import, it's enough to select just driverlib', inc, usblib and utils.
The other option would be adding path to the relevant include files (see Project tab). You might have to explicitly define some of the make macros like -DTARGET_IS_BLIZZARD_RA1 under the Project tab to get ROM_ and MAP_ prefixed functions to resolve correctly, but it was not necessary in my case.
Stellaris Launchpad as simple logic analyzer
Given the clock speed of Stellaris Launchpad, it's fairly fast enough for snapping signals. With a bit of proper synchronization, can be used as a logic analyzer with short memory (alternatively direct download link for the tar.gz). In the comments towards the end, there is a version that uses more than 16 kB RAM, meaning longer time interval can be sampled.
The code turns Stellaris into SUMP-protocol compatible device, you can use OLS Logic Sniffer client to read from it. Any time a GPIO value on PORTB[0..7] changes, the capture starts. Note: PB0 and PB1 are limited to 3.6 V! All other pins of PORTB are 5 V tolerant.
First flash the sllogiclogger.bin image onto Stellaris you'll use for measurement. Then copy over the config file ols.profile-SLLogicLogger.cfg from sllogiclogger tarball to ols-0.9.6.1/plugins directory (or whatever your version of OLS is).
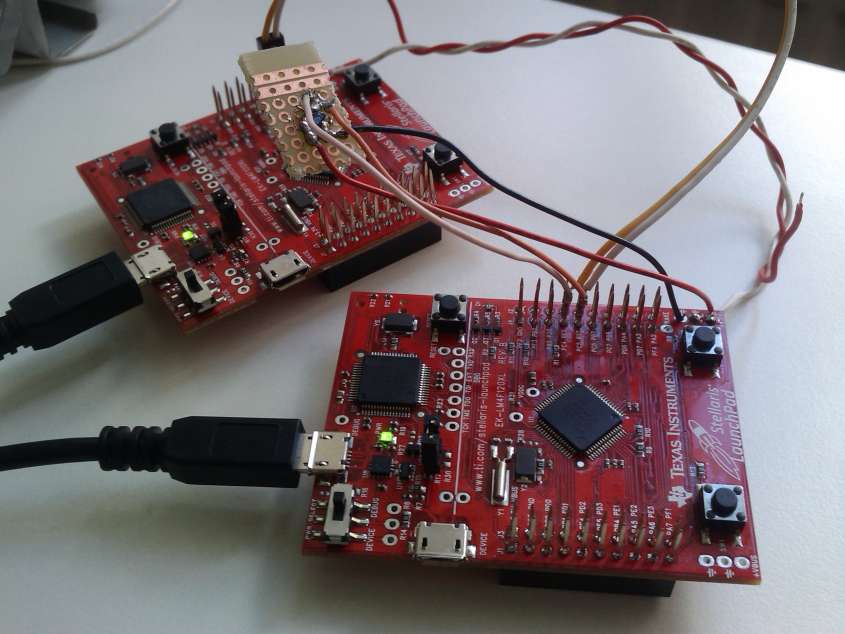
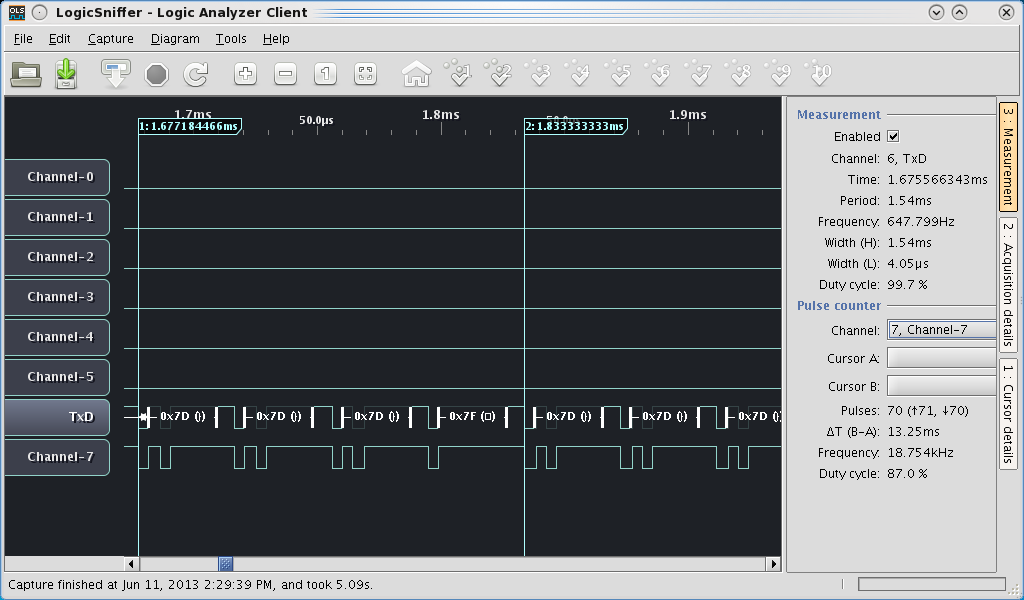
Sample showing sllogiclogger for debugging ATSHA204 single-wire communication. One Stellaris controls the ATSHA204, the other Stellaris serves as sllogiclogger. PB6 and PB7 are used to read from, as the OLS screen shows.
You might want to change the line ols.profile-SLLogicLogger.cfg containing device.samplerates to make your measurement more precise. Since sllogiclogger uses raw for() cycle without interrupts and DMA, the actual sampling frequency highly depends on compiler and flags used when you compile the sllogiclogger.
For instance, I didn't need 10 MHz, I was okay with 1 MHz but longer captute. So after some measurements I've found out that using 1236000 Hz for device.samplerates and changing sllogiclogger.c divider SYSCTL_SYSDIV_27 in ROM_SysCtlClockSet call, it measures fairly accurately when it's compiled with -O2 flag with the recommended toolchain mentioned above.
Though for any more serious work, it's best to use a real logic analyzer, like Open Bench Logic Sniffer.
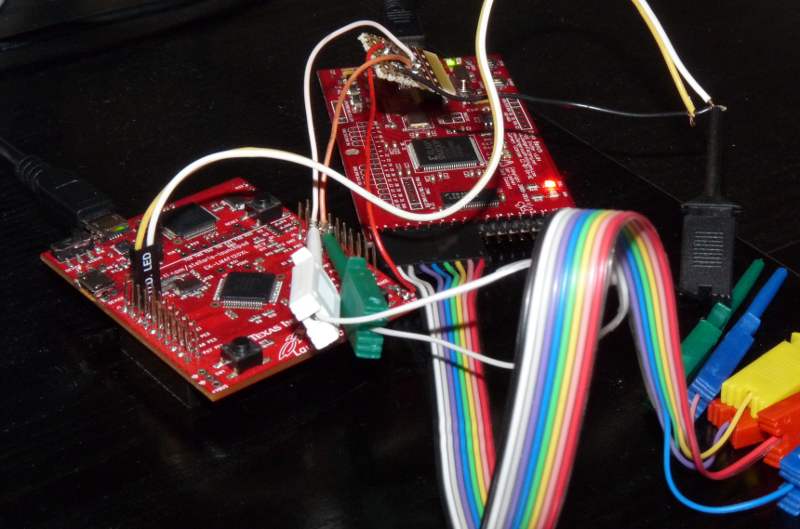
Open Bench Logic Sniffer with OLS client
First of all, it is absolely substantial to flash both FPGA and PIC firmware of Open Bench sniffer to make it work reliably with OLS client - see updates. Otherwise the triggers may not work reliably. Note that the flashing new FPGA/PIC firmware may not work the first time, try multiple attempts (also, Linux OLS updater depends on old libusb shared libraries). Links for quickstart and using triggers:
Udev rules file for fast copy-pasta (last line should sidestep potential issues with modem-manager):
#File /etc/udev/rules.d/55-ols.rules
#Rules for Open Bench Logic Sniffer
# Creates nice /dev/OpenLogicSniffer symlink writable even for users not part of dialout group
ATTRS{idVendor}=="04d8", ATTRS{idProduct}=="fc92", MODE="0666", SYMLINK+="OpenLogicSniffer"
ATTRS{idVendor}=="04d8", ATTRS{idProduct}=="fc92", ENV{ID_MM_DEVICE_IGNORE}="1"
PureJavacomm exceptions on Linux kernel 3.7+ for non-root users
If you are unable to capture data under non-root user despite having correctly set udev rules, you'll need PureJavacomm update. The exception message is:
java.lang.IllegalStateException: JTermios call returned -1 at class jtermios.JTermios JTermiosLogging line 489
Symptoms detailed:
- Broken on kernel 3.7 - strace shows
ioctl(TIOCSSERIAL, …)call failing
Quick fix:
The fix for PureJavacomm is described in issues #133 and #159. Snapshot for OLS 0.9.7 contains the fix:
Sample photo: Open Bench Logic Sniffer debugging ATSHA204 on Stellaris Launchpad
Here is Open Bench Logic Sniffer showing communication from ATSHA204. Note that channel 0 contains different single-wire (not 1-wire!) communication for RX and TX separately as specified by ATSHA204 docs (203.4 and 166.6 kbaud). OLS screenshot comes from OLS 0.9.7 development snapshot.

J-Link external JTAG with OpenOCD
Example: debugging Proxmark (Atmel AT91SAM7S256)
OpenOCD has interface file for J-link in interface/jlink.cfg directory and target/at91sam7x256.cfg for the chip, but both require some changes:
- setting JTAG speed
- disabling
gdb_memory_map(we'd need to send correct memory map to tell which memory areas belong to flash and should be protected) - requesting hard breakpoints (for some reason soft breakpoints don't work, it seems to have to be related to missing memory map)
OpenOCD config file
Create a file name proxmark3-jlink.cfg with this content:
(Sorry I had to put it here zipped as it couldn't be uploaded as .cfg and neither put as file/code into the page - it was impossible to escape)
Putting it together
The “load” command was not working correctly for me, so I had to use the flasher utility to flash the OS image (./client/flasher /dev/ttyACM0 ./armsrc/obj/osimage.elf). Alternatively it's possible to use the J-link JTAG to flash image (see below).
As usual, run openocd first:
openocd -f proxmark3-jlink.cfg
Then GDB in another terminal - arm-none-eabi-gdb armsrc/obj/fullimage.elf. It's recommended that you recompile code with debugging symbols enabled. In gdb shell, connect to gdb server and try a breakpoint on some simple function:
target extended-remote :3333
continue
## press Ctrl-C to break ##
backtrace
## you should see some valid backtrace now
break 'SendVersion'
continue
When you run proxmark client (./client/proxmark3 /dev/ttyACM0), give it hw version command. GDB should now break at the SendVersion breakpoint you've set before.
Example: Unbricking (restoring) Proxmark bootloader
When bootloader gets overwritten into unusable state, this method can be used to overwrite flash sectors with fresh correct bootloader. The config file below is very similar to the one used for code debugging (I guess that one could work too, not sure about the memory map enabling).
Run openocd in one terminal:
openocd -f proxmark3-jlink-reflash.cfg
In another terminal, use netcat or telnet to connect to port 4444 where openocd's shell runs:
nc localhost 4444
Give these commands to openocd:
halt
flash erase_sector 0 0 last
flash write_image /full/path/to/bootrom.elf 0 elf
The code halts processor, erases bootloader sectors, then writes bootloader from /path/to/booloader.elf. After power cycling the bootloader should be working if the elf file is correct.
J-link connected to Proxmark

Flyswatter connected to Proxmark
Flyswatter needs TDI pin connected, otherwise it won't work. SWD protocol seems not to work with Flyswatter. You can use board config from above section with:
openocd -f interface/ftdi/flyswatter.cfg -f board/proxmark3-jlink.cfg
Flyswatter debugging Proxmark

FTDI C232HM-DDHSL-0 cable
The FTDI C232HM-DDHSL-0 cable( datasheet) is a handy portable cable that combines UART, JTAG, I2C and SPI. UART works out-of-the-box, SPI and I2C are supported through libmpsse. JTAG is supported in OpenOCD, use this config (save it as interface/ftdi/c232hm.cfg under scripts). It's actually the same hardware as Digilent SMT2 JTAG.
#
# FTDI C232HM-DDHSL-0
#
# http://www.ftdichip.com/Products/Cables/USBMPSSE.htm
#
# Config is based on tumpa-lite.cfg
#

interface ftdi
adapter_khz 12000
#gdb_memory_map disable

ftdi_vid_pid 0x0403 0x6014

ftdi_layout_init 0x0038 0x087b
# ??? is this correct - connect nTRST to grey cable, GPIOL0
#ftdi_layout_signal nTRST -data 0x0010 -oe 0x0010
# connect to purple cable, GPIOL1 (is this correct? seems to work with side effects)
#ftdi_layout_signal nSRST -data 0x0020 -oe 0x0020
The only strange this is that the FTDI cable is missing nSRST signal, so you can't reset the processor via monitor reset halt. Connecting nSRST to GPIO pin and using nSRST in config as noted above will allow you to reset via monitor reset halt.
UrJTAG
UrJTAG doesn't have named driver for this, but you can use Flyswatter, JTAGkey, Signalyzer or Turtelizer2 explicitly specifying USB PID, e.g.:
jtag> cable Flyswatter pid=0x6014
Connected to libftdi driver.
jtag> bsdl path Downloads/
jtag> detect
IR length: 4
Chain length: 1
Device Id: 00111111000011110000111100001111 (0x3F0F0F0F)
*  Filename:     Downloads//AT91SAM7S256.bsd
Weird quirk: after using OpenOCD, UrJTAG won't detect anything with detect command unless you replug the FTDI cable.
Chipwhisperer + UFO target board + STLink v2 + STM32F4
Chipwhisperer with UFO target board installed with STM32F4.
The STM32F4 can be programmed via Chipwhisperer IDE (you need to use “slow” setting, otherwise it seems to fail) or STLink as usual with gdb+openocd.

Example building the AES target program simpleserial-aes:
make PLATFORM=CW308_STM32F4 CRYPTO_TARGET=TINYAES128C
Fix for Ubuntu 18.04's broken newlib and GDB
Ubuntu 18.04 since has broken newlib - error: /usr/lib/gcc/arm-none-eabi/6.3.1/../../../arm-none-eabi/lib/crt0.o: Conflicting CPU architectures 13/1.
Fix can be seen in this github issue comment.
To fix it, download and install packages:
Install those two packages:
dpkg -i libnewlib-dev_3.0.0.20180802-2_all.deb libnewlib-arm-none-eabi_3.0.0.20180802-2_all.deb
You need to install GDB from sources, as the gdb-multiarch seems broken. See above for building gdb for arm-none-eabi with python.
Running OpenOCD and debugger
Run OpenOCD in one terminal, or use QtCreator setup mentioned above. There is option to use CLion. QtCreator is great if you want free (free as in beer also LGPL) IDE, but CLion is better when it comes to code completion in C++11 and later, especially through templates that extend classes like smart pointers. Though for C code, both are about the same. Maybe QtCreator can be preferrable.
openocd -f interface/stlink-v2.cfg -f target/stm32f4x.cfg
If you have different model, e.g. STM32F3 (or F2/F0), just change that parameter in openocd invocation, for F3 (the second file points to config in openocd installed configs):
openocd -f interface/stlink-v2.cfg -f target/stm32f3x.cfg
In another terminal, run gdb (modern gdb supports multiple architectures, you need gdb-multiarch or such package, but compiling latest version yourself might be preferrable) with target file, e.g. arm-none-eabi-gdb hardware/victims/firmware/simpleserial-aes.arm-stm32f4/simpleserial-aes-CW308_STM32F4.elf. Note that the clock setting in Chipwhisperer IDE might influence the clocks in OpenOCD configs. So far GDB seems to handle it well on its own. If you are using CW308 UFO board, there is J3 switch to select clock. Unless you want to do something special with the clock, use “HS2/OUT” jumper option. Clock selection is important for glitching clock, for example.
GNU gdb (7.10-1ubuntu3+9) 7.10
Copyright (C) 2015 Free Software Foundation, Inc.
License GPLv3+: GNU GPL version 3 or later <http://gnu.org/licenses/gpl.html>
This is free software: you are free to change and redistribute it.
There is NO WARRANTY, to the extent permitted by law.  Type "show copying"
and "show warranty" for details.
This GDB was configured as "--host=x86_64-linux-gnu --target=arm-none-eabi".
Type "show configuration" for configuration details.
For bug reporting instructions, please see:
<http://www.gnu.org/software/gdb/bugs/>.
Find the GDB manual and other documentation resources online at:
<http://www.gnu.org/software/gdb/documentation/>.
For help, type "help".
Type "apropos word" to search for commands related to "word"...
Reading symbols from hardware/victims/firmware/simpleserial-aes.arm-stm32f4/simpleserial-aes-CW308_STM32F4.elf...done.
(gdb) target extended-remote :3333
Remote debugging using :3333
0x00000000 in ?? ()
(gdb) monitor reset halt
Unable to match requested speed 1000 kHz, using 950 kHz
Unable to match requested speed 1000 kHz, using 950 kHz
adapter speed: 950 kHz
target state: halted
target halted due to debug-request, current mode: Thread
xPSR: 0x01000000 pc: 0x080014e4 msp: 0x20003000
(gdb) load
Loading section .isr_vector, size 0x188 lma 0x8000000
Loading section .text, size 0x140c lma 0x8000188
Loading section .rodata, size 0x24 lma 0x8001594
Loading section .init_array, size 0x4 lma 0x80015b8
Loading section .fini_array, size 0x4 lma 0x80015bc
Loading section .data, size 0x20c lma 0x80015c0
Start address 0x80014e4, load size 6092
Transfer rate: 14 KB/sec, 1015 bytes/write.
(gdb) monitor reset init
Unable to match requested speed 1000 kHz, using 950 kHz
Unable to match requested speed 1000 kHz, using 950 kHz
adapter speed: 950 kHz
target state: halted
target halted due to debug-request, current mode: Thread
xPSR: 0x01000000 pc: 0x080014e4 msp: 0x20003000
Unable to match requested speed 8000 kHz, using 4000 kHz
Unable to match requested speed 8000 kHz, using 4000 kHz
adapter speed: 4000 kHz
(gdb) c
Continuing.
Side channels
There is a separate project for Chipwhisperer and its usage for side channels. Look there.